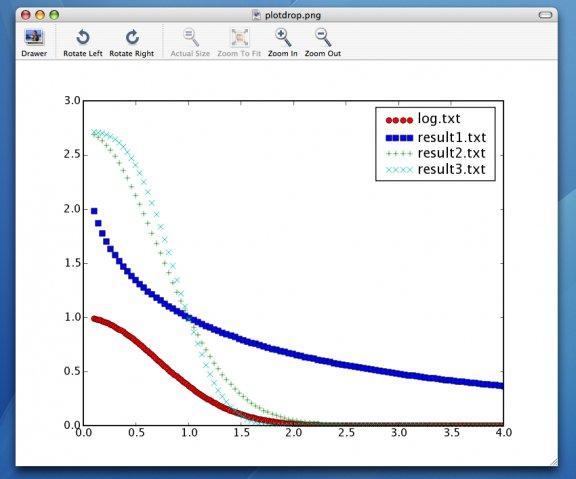
Scatter Plot
Advertisement
Hertzsprung Russell (H-R) Diagrams v.1.0
Hertzsprung-Russell (H-R) Diagrams model simulates Hertzsprung-Russell (HR or H-R) diagram for groups of stars. The diagram is a scatter plot of steller luminosity vs. stellar temperature.
Advertisement
Interactive Variogram v.1.0
Check the variogram response when moving scatter plot points. Interactive Variogram is for investigating interactively and immediately the response of variogram to movement of sample points. Thanks to its novel and innovative design the quality of
Scatter To Table v.1.0
It is a simple but very useful software application in the hope to assist researchers in the process of generating arbitrary sampling data for evaluation of algorithms and methodologies e.g.
TableView v.1.0
View genomic data with this tool. TableView help you with the visualization of genomic data. TableView can present data in spreadsheet format, which lets you sort, copy and paste rows, etc. It also lets you view scatter plots comparing columns in the
WorkSheet Manager v.1.0
The Worksheet Manager is a powerful utility that allows you to list all open Excel workbooks, display all worksheets and chart sheets in a selected workbook and quickly select a worksheet or chart sheet of interest.
Star System Simulator v.3.0
Perform 3D simulations of planetary positions. Star System Simulator can perform 3D simulations of planetary positions using Euler-Cromer and Runge-Kutta (4th order) methods.
Plot Digitizer v.2. 4. 2001
Plot Digitizer is a great piece of software developed by Joseph A. Huwaldt. The main goal of the program is to extract information from two-dimensional plots or graphs.
Rt-Plot v.2.8.10.84
Rt-Plot is a tool to generate Cartesian X/Y-plots from scientific data. You can enter and calculate tabular data. View the changing graphs, including linear and non linear regression, interpolation, differentiation and integration, during entering.
Z-Plot v.1 1
Z-Plot is a free plotting software that allows you to visualize a multitude of mathematical functions and curves. The software has a powerful mathematical formula interpreter, that also allows the user to handle complex numbers, easily.
Fry Plot Program v.1 1
The program developed very useful and versatile in the sense that complete annotation of the plot and caption and legend and printing facility is available in the very program and you do not, unlike other programs, have to export the plot to other pr